Compare performance of model between training and test set
Source:R/training_test_comparison.R
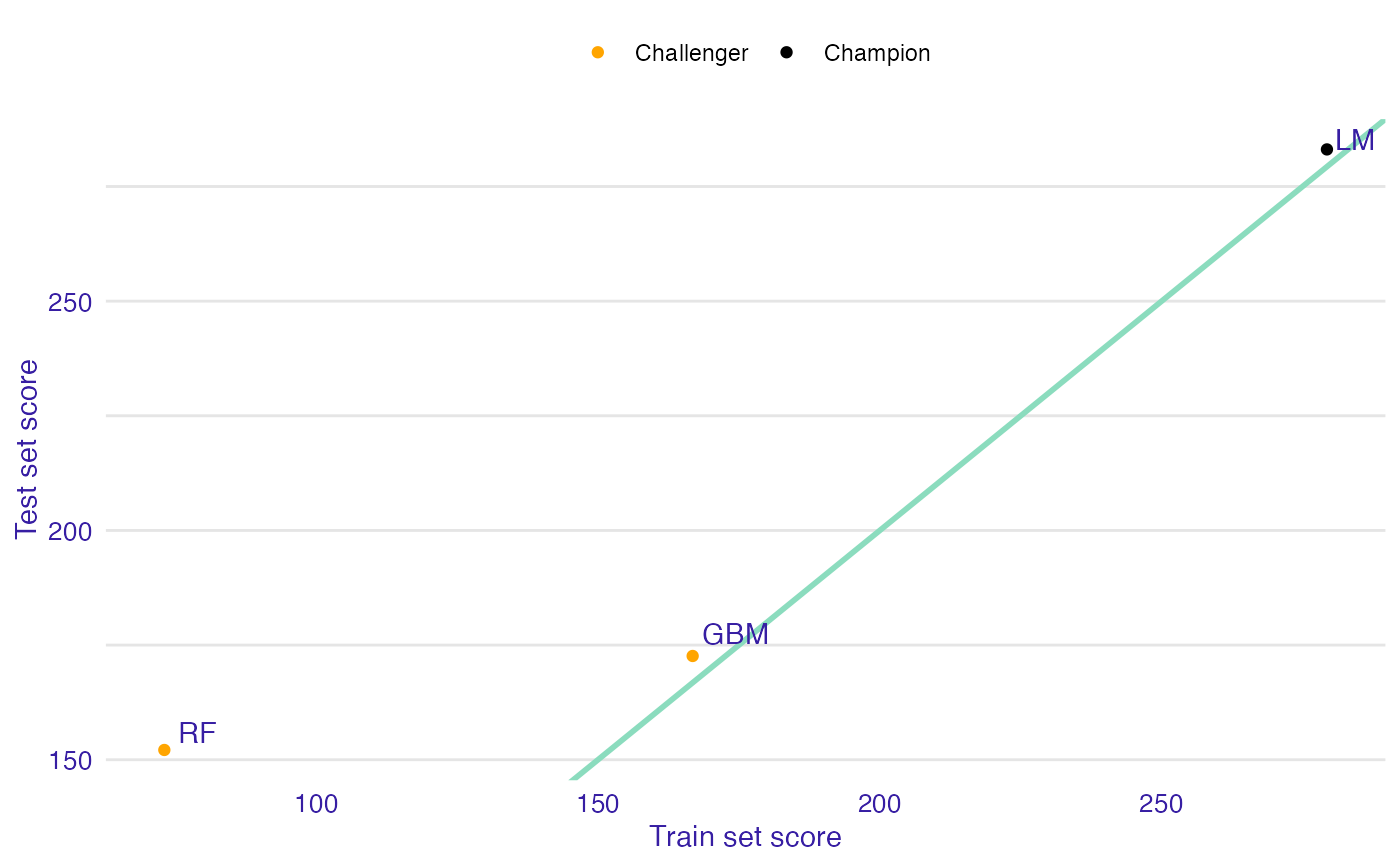
trainig_test_comparison.RdFunction training_test_comparison calculates performance of the provided model based on specified measure function.
Response of the model is calculated based on test data, extracted from the explainer and training data, provided by the user.
Output can be easily shown with print or plot function.
training_test_comparison(
  champion,
  challengers,
  training_data,
  training_y,
  measure_function = NULL
)
Arguments
- champion
- explainer of champion model.
- challengers
- explainer of challenger model or list of explainers.
- training_data
- data without target column that will be passed to predict function and then to measure function. Keep in mind that they have to differ from data passed to an explainer.
- training_y
- target column for
training_data- measure_function
- measure function that calculates performance of model based on true observation and prediction. Order of parameters is important and should be (y, y_hat). By default it is RMSE.
Value
An object of the class training_test_comparison.
It is a named list containing:
datadata.frame with following columnsmeasure_testperformance on test setmeasure_trainperformance on training setlabellabel of explainertypeflag that indicates if explainer was passed as champion or as challenger.
models_infodata.frame containing information about models used in analysis
Examples
library("mlr")
library("DALEXtra")
task <- mlr::makeRegrTask(
 id = "R",
  data = apartments,
   target = "m2.price"
)
 learner_lm <- mlr::makeLearner(
 "regr.lm"
)
model_lm <- mlr::train(learner_lm, task)
explainer_lm <- explain_mlr(model_lm, apartmentsTest, apartmentsTest$m2.price, label = "LM")
#> Preparation of a new explainer is initiated
#>   -> model label       :  LM
#>   -> data              :  9000  rows  6  cols
#>   -> target variable   :  9000  values
#>   -> predict function  :  yhat.WrappedModel  will be used (  default  )
#>   -> predicted values  :  No value for predict function target column. (  default  )
#>   -> model_info        :  package mlr , ver. 2.19.0 , task regression (  default  )
#>   -> predicted values  :  numerical, min =  1792.597 , mean =  3506.836 , max =  6241.447
#>   -> residual function :  difference between y and yhat (  default  )
#>   -> residuals         :  numerical, min =  -257.2555 , mean =  4.687686 , max =  472.356
#>   A new explainer has been created!

learner_rf <- mlr::makeLearner(
"regr.ranger"
)
model_rf <- mlr::train(learner_rf, task)
explainer_rf <- explain_mlr(model_rf, apartmentsTest, apartmentsTest$m2.price, label = "RF")
#> Preparation of a new explainer is initiated
#>   -> model label       :  RF
#>   -> data              :  9000  rows  6  cols
#>   -> target variable   :  9000  values
#>   -> predict function  :  yhat.WrappedModel  will be used (  default  )
#>   -> predicted values  :  No value for predict function target column. (  default  )
#>   -> model_info        :  package mlr , ver. 2.19.0 , task regression (  default  )
#>   -> predicted values  :  numerical, min =  1791.981 , mean =  3505.215 , max =  6256.597
#>   -> residual function :  difference between y and yhat (  default  )
#>   -> residuals         :  numerical, min =  -543.8599 , mean =  6.308188 , max =  743.5935
#>   A new explainer has been created!

learner_gbm <- mlr::makeLearner(
"regr.gbm"
)
model_gbm <- mlr::train(learner_gbm, task)
explainer_gbm <- explain_mlr(model_gbm, apartmentsTest, apartmentsTest$m2.price, label = "GBM")
#> Preparation of a new explainer is initiated
#>   -> model label       :  GBM
#>   -> data              :  9000  rows  6  cols
#>   -> target variable   :  9000  values
#>   -> predict function  :  yhat.WrappedModel  will be used (  default  )
#>   -> predicted values  :  No value for predict function target column. (  default  )
#>   -> model_info        :  package mlr , ver. 2.19.0 , task regression (  default  )
#>   -> predicted values  :  numerical, min =  2123.673 , mean =  3505.638 , max =  6058.835
#>   -> residual function :  difference between y and yhat (  default  )
#>   -> residuals         :  numerical, min =  -520.6726 , mean =  5.885672 , max =  760.7353
#>   A new explainer has been created!

data <- training_test_comparison(explainer_lm, list(explainer_gbm, explainer_rf),
                                 training_data = apartments,
                                 training_y = apartments$m2.price)
plot(data)