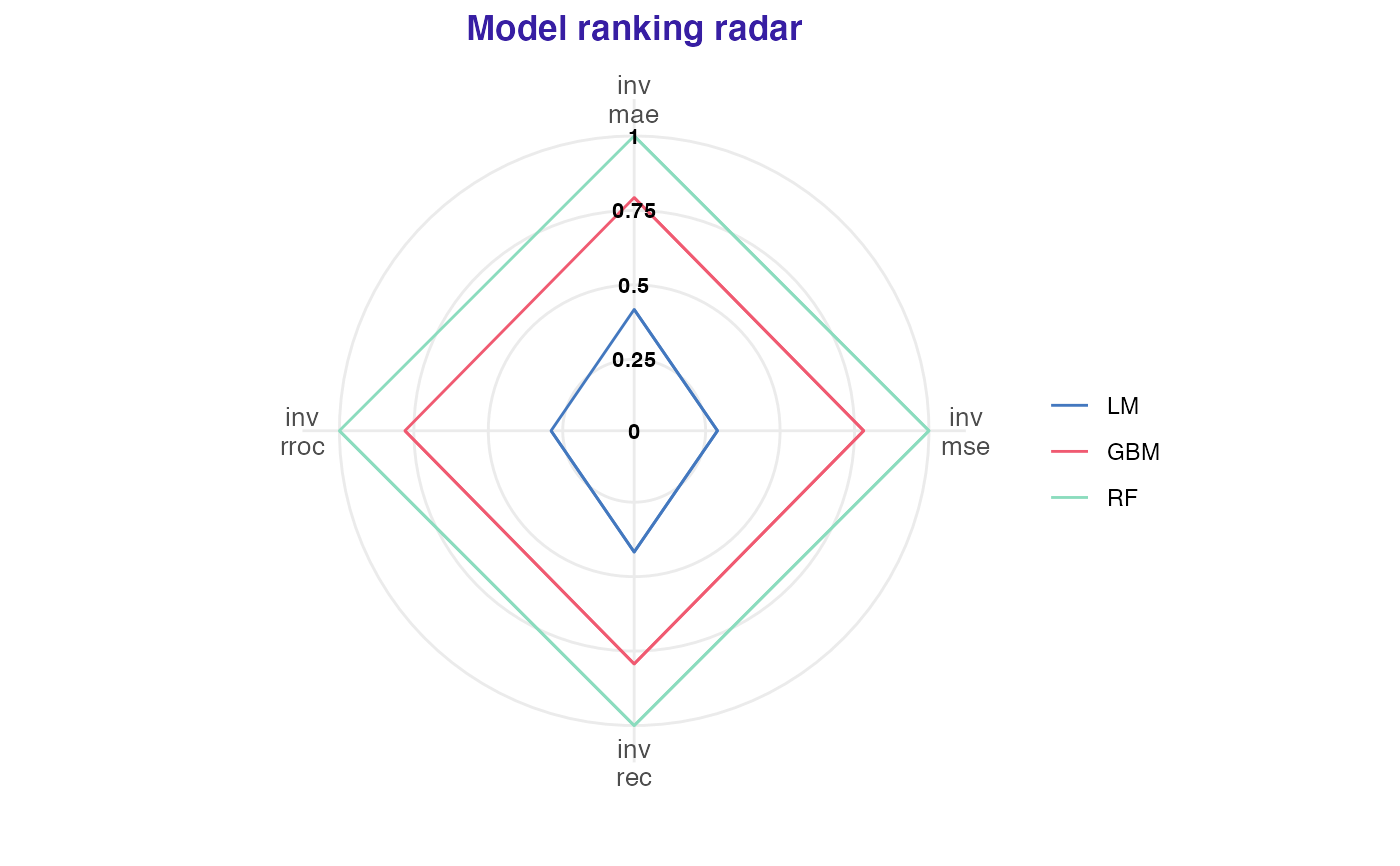
The function plots data created with overall_comparison. For radar plot it uses auditor's
plot_radar. Keep in mind that the function creates two plots returned as list.
# S3 method for overall_comparison
plot(x, ...)
Arguments
- x
- data created with
overall_comparison- ...
- other parameters
Value
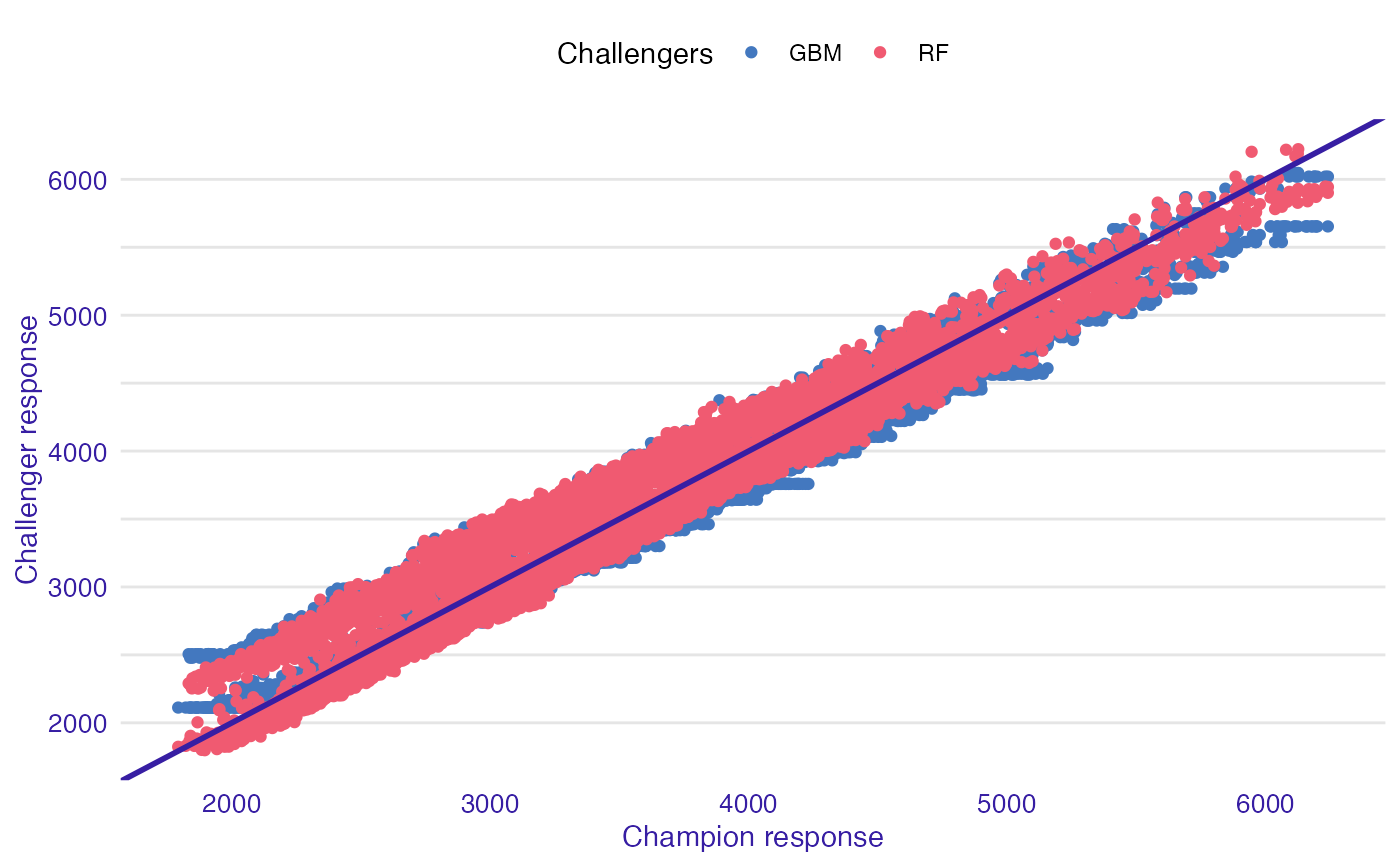
A named list of ggplot objects. It consists of:
radar_plotplot created withplot_radaraccordance_plotaccordance plot of responses. OX axis stand for champion response, while OY for one of challengers responses. Colour indicates on challenger.
Examples
# \donttest{
library("DALEXtra")
library("mlr")
task <- mlr::makeRegrTask(
id = "R",
data = apartments,
target = "m2.price"
)
learner_lm <- mlr::makeLearner(
"regr.lm"
)
model_lm <- mlr::train(learner_lm, task)
explainer_lm <- explain_mlr(model_lm, apartmentsTest, apartmentsTest$m2.price, label = "LM")
#> Preparation of a new explainer is initiated
#> -> model label : LM
#> -> data : 9000 rows 6 cols
#> -> target variable : 9000 values
#> -> predict function : yhat.WrappedModel will be used ( default )
#> -> predicted values : No value for predict function target column. ( default )
#> -> model_info : package mlr , ver. 2.19.0 , task regression ( default )
#> -> predicted values : numerical, min = 1792.597 , mean = 3506.836 , max = 6241.447
#> -> residual function : difference between y and yhat ( default )
#> -> residuals : numerical, min = -257.2555 , mean = 4.687686 , max = 472.356
#> A new explainer has been created!
learner_rf <- mlr::makeLearner(
"regr.ranger"
)
model_rf <- mlr::train(learner_rf, task)
explainer_rf <- explain_mlr(model_rf, apartmentsTest, apartmentsTest$m2.price, label = "RF")
#> Preparation of a new explainer is initiated
#> -> model label : RF
#> -> data : 9000 rows 6 cols
#> -> target variable : 9000 values
#> -> predict function : yhat.WrappedModel will be used ( default )
#> -> predicted values : No value for predict function target column. ( default )
#> -> model_info : package mlr , ver. 2.19.0 , task regression ( default )
#> -> predicted values : numerical, min = 1798.643 , mean = 3503.859 , max = 6221.87
#> -> residual function : difference between y and yhat ( default )
#> -> residuals : numerical, min = -529.6339 , mean = 7.664423 , max = 759.7997
#> A new explainer has been created!
learner_gbm <- mlr::makeLearner(
"regr.gbm"
)
model_gbm<- mlr::train(learner_gbm, task)
explainer_gbm <- explain_mlr(model_gbm, apartmentsTest, apartmentsTest$m2.price, label = "GBM")
#> Preparation of a new explainer is initiated
#> -> model label : GBM
#> -> data : 9000 rows 6 cols
#> -> target variable : 9000 values
#> -> predict function : yhat.WrappedModel will be used ( default )
#> -> predicted values : No value for predict function target column. ( default )
#> -> model_info : package mlr , ver. 2.19.0 , task regression ( default )
#> -> predicted values : numerical, min = 2112.462 , mean = 3505.275 , max = 6046.481
#> -> residual function : difference between y and yhat ( default )
#> -> residuals : numerical, min = -509.462 , mean = 6.248255 , max = 724.3794
#> A new explainer has been created!
data <- overall_comparison(explainer_lm, list(explainer_gbm, explainer_rf), type = "regression")
plot(data)
#> $radar_plot
 #>
#> $accordance_plot
#>
#> $accordance_plot
 #>
# }
#>
# }